
Website ESG Content That Resonates With Investors
Environmental, social, and governance (ESG) issues are increasingly shaping investors’ priorities. Global sustainable fund assets reached $3.9 trillion in September 2021 and continue to grow at a breathtaking rate. Investors do not look at ESG from an altruistic perspective. They look at ESG from the perspective of risk. 79 percent of companies believe ESG risk is important, and climate change is one of the largest risks. To assess how well businesses manage the risk of ESG, investors are demanding consistent ESG data and narrative to support their investment decision-making. So, what kind of ESG content are investors looking at?
At Investis Digital, we’ve taken a deeper dive into investor expectations by using propriety data to analyze how investors navigate corporate sites and what they look for. Here’s what we found.
Sustainability strategy
Investors want more than just ESG performance data. They want to understand your sustainability strategy and how it aligns with the material risks and opportunities your business faces in the short and longer term.
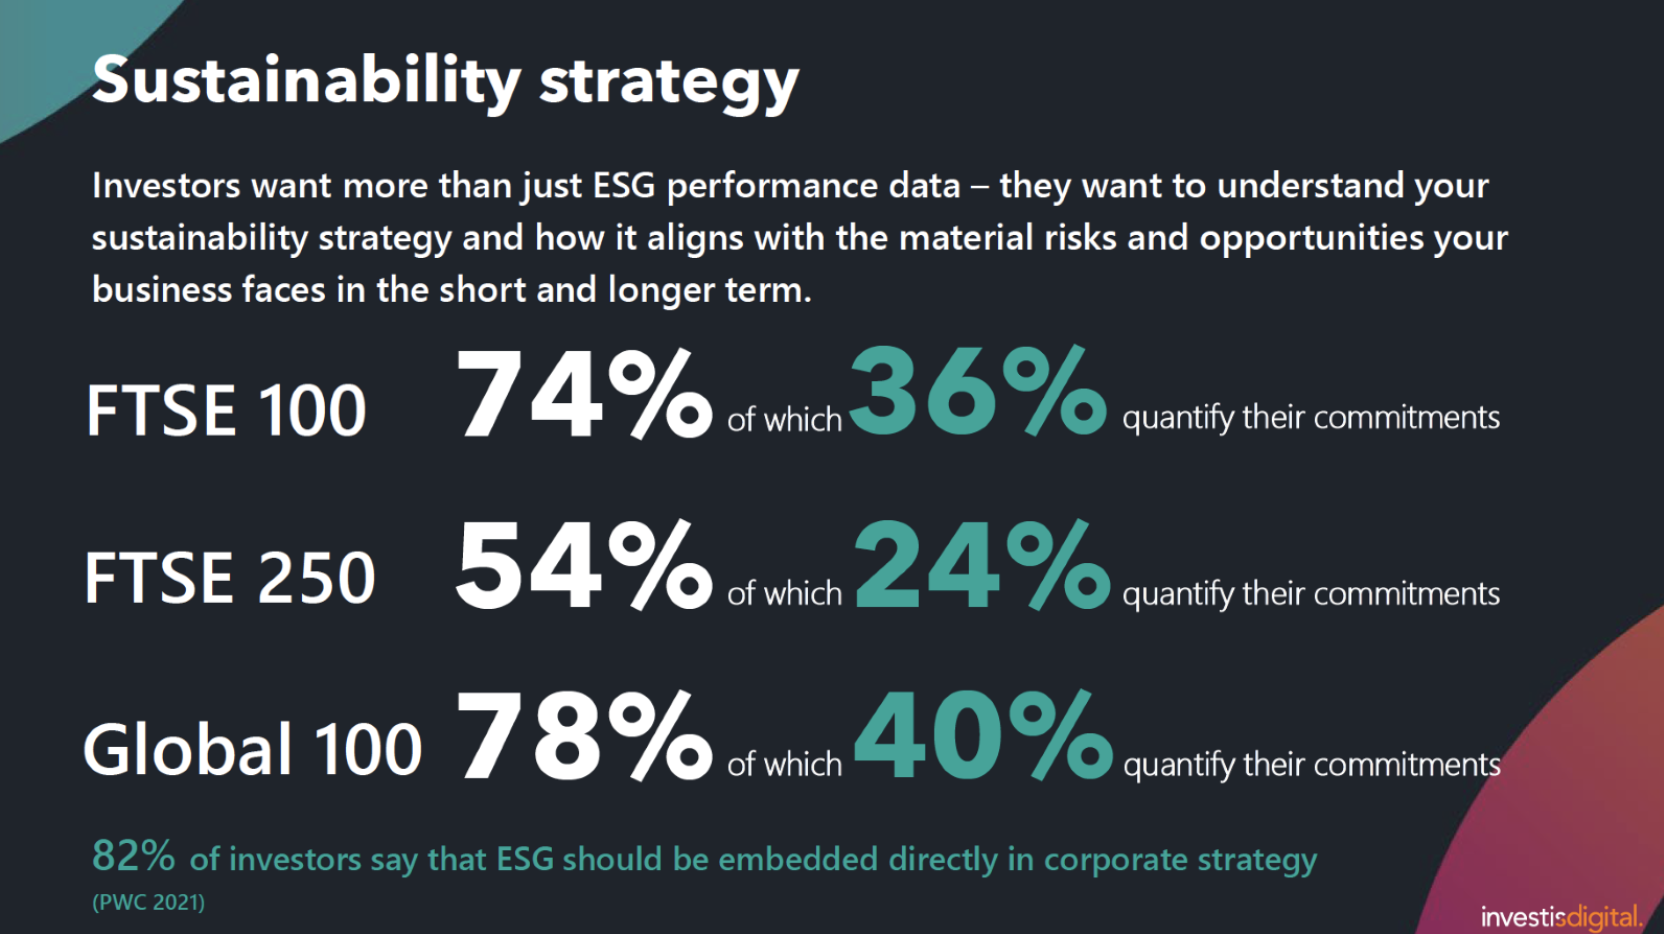
The Financial Times Stock Exchange (FTSE) 100 do a good job sharing its strategy, but our research shows that only 36 percent quantify their commitments. The disparity between sharing a strategy and quantifying commitments exists across the board. In a world of increasing uncertainty, numbers provide clarity. Going forward, businesses need to provide that clarity.
Connecting purpose and ESG strategy
Being purpose-driven has been a big area of focus in recent years, and it’s a topic I talked about recently here. Are you connecting the dots between purpose, corporate, and ESG strategy?
If not, your stakeholders may question if you’re purpose-led or simply “purpose washing.” I think Vodafone does an outstanding job linking business strategy, purpose, and sustainability strategy. I would recommend reviewing how Vodafone connects the dots between these core topics.
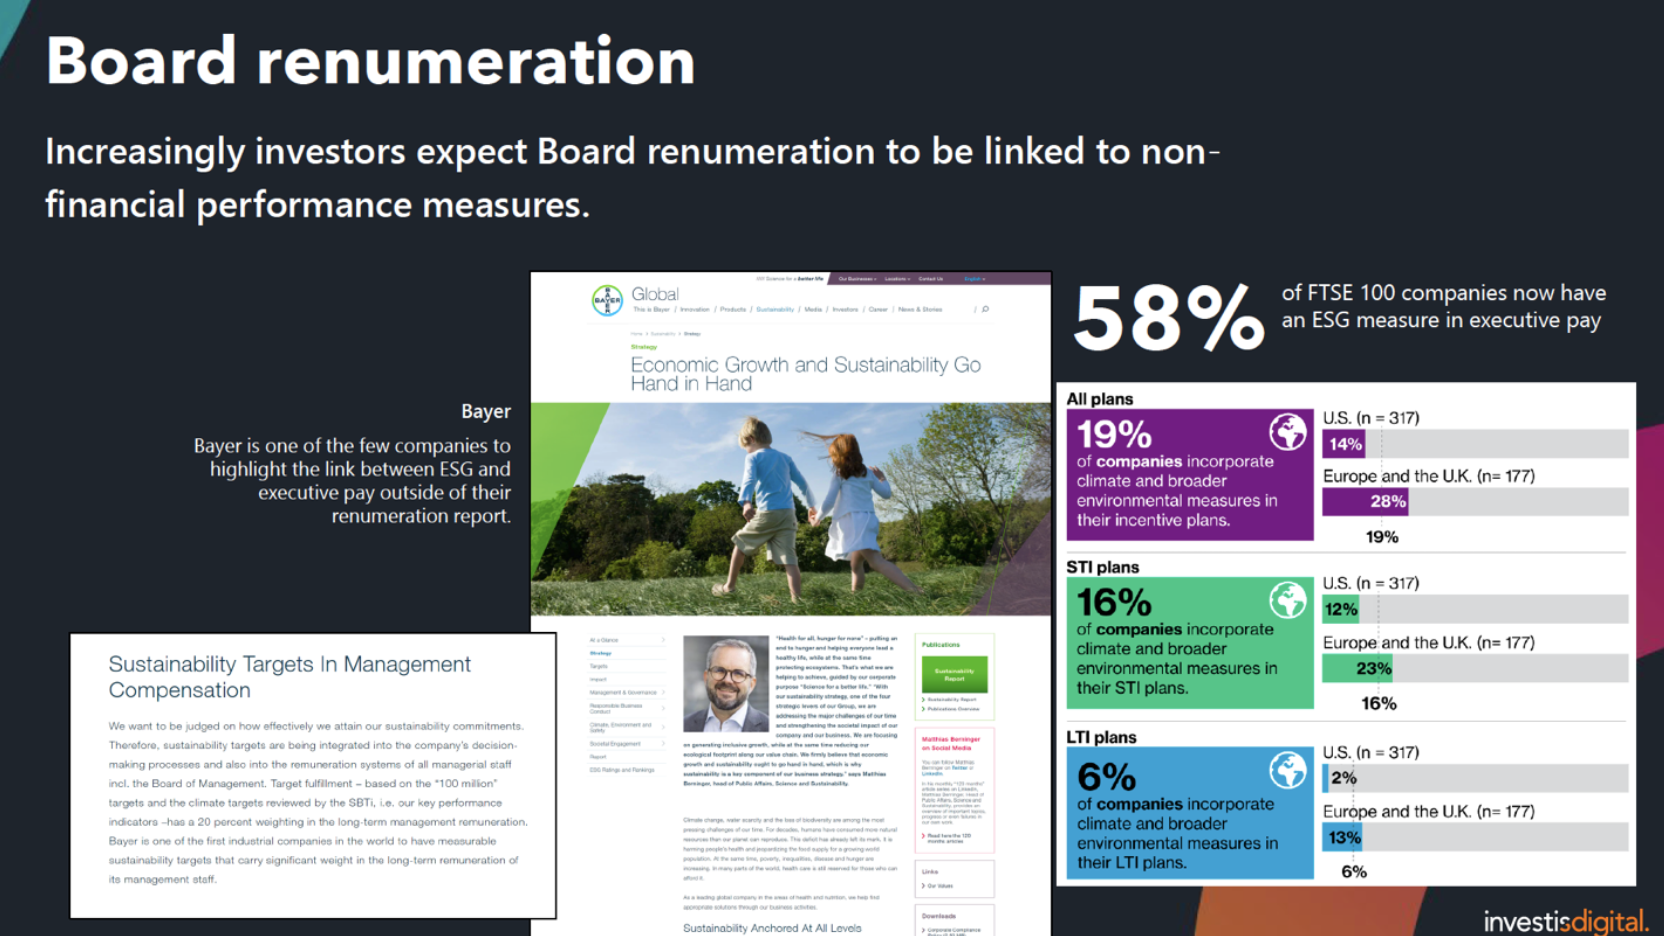
Board remuneration
Companies are increasingly under pressure to link board remuneration to ESG performance. Indeed, about 58% of FTSE 100 companies now have an ESG measure in executive pay. But although investors demand it, most companies only disclose the fact that they include ESG measures in their executive pay in their remuneration report.
The standout, though, is Bayer. Bayer is one of the few companies to highlight the link between ESG and executive pay outside of their remuneration report. Its ESG strategy landing page connects economic growth, sustainability targets, and compensation. Hats off to Bayer!
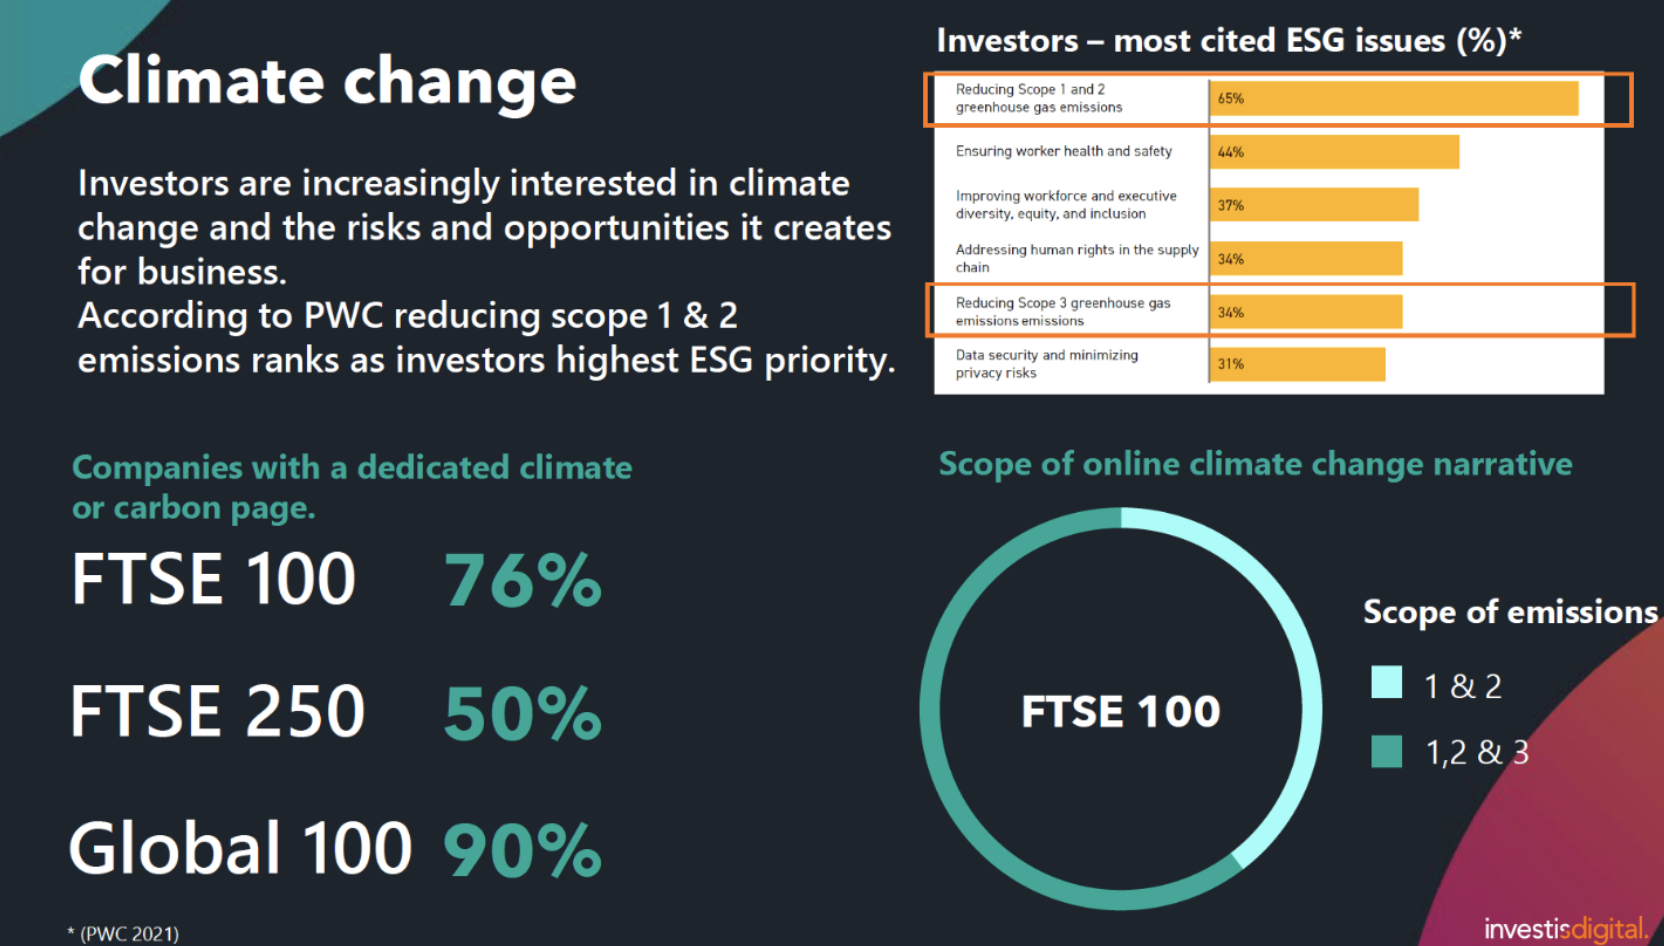
Climate change
Investors are increasingly interested in climate change and the risks and opportunities it creates for business. According to PWC, reducing scope 1 & 2 emissions ranks as investors’ highest ESG priority, and they are also prioritizing scope 3, supply chain emissions. Most of the FTSE 100 have a dedicated climate or carbon page – but only half of the FTSE 250 do. This situation will change as investors increase the pressure to manage the risk of climate change.
The race to net zero
We’ve all heard about the race to net zero. Most businesses have made major announcements about their commitment to becoming net-zero albeit under different time frames. But how many companies are publishing a road map to becoming net-zero? Currently, 44 percent of the FTSE are making it clear how they will reach their net-zero commitment. Most are focused on both their own initiatives and those of their value chains (scope 1, 2, and 3 emission road maps). The majority make this content in HTML and PDF formats, making them attractive to a variety of devices. Here is what a road map might look like:
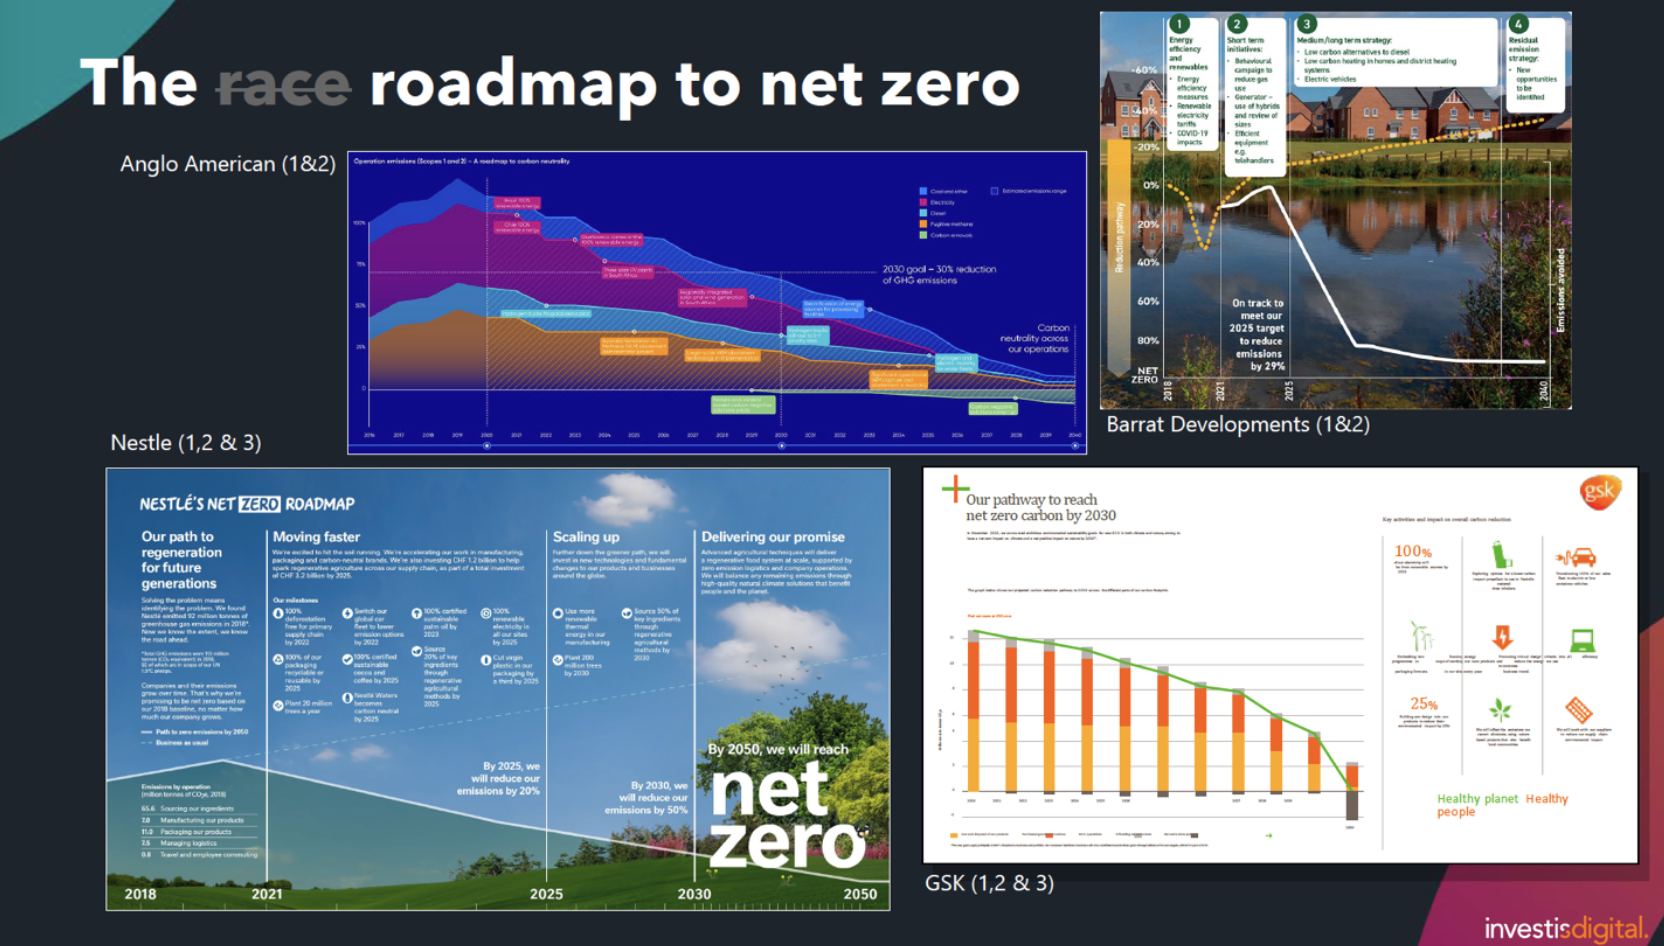
Please visit the websites for Anglo American, Barrat Developments, GSK, and Nestle, all of which provide a mixture of scope 1 and 2 or scope 1, 2, and 3 emission roadmaps.
ESG benchmarks and ratings
Let’s face it: ESG benchmarks and ratings require a lot of effort to provide data to rating agencies. But they are very important. Almost 70 percent of investors use ESG ratings to make their investing decisions – but less than 50 percent of FTSE 100 provide any narrative or list of benchmarks and ratings they have. This is another area where businesses will need to get better at aligning their content with investor expectations. Being transparent on how your business ranks will resonate at a time when investors need to see more transparency.
ESG 100 reporting frameworks
Reporting frameworks are proliferating. UN SDGs, SASB, GRI, TCFD, CPPD, WEF – the list goes on. Across the FTSE 100 UN SDG’s are the most popular framework – but we’ve seen more companies adopting SASB over the last year. As the introduction of mandatory TCFD reporting in the UK nears (April 2022) we expect to see more early adopters this year. We’re already talking to European listed clients about early adoption of the EU Corporate Sustainability Reporting Directive (CSRD 2024) with its double materiality assessment requirements – which makes reporting more complicated.
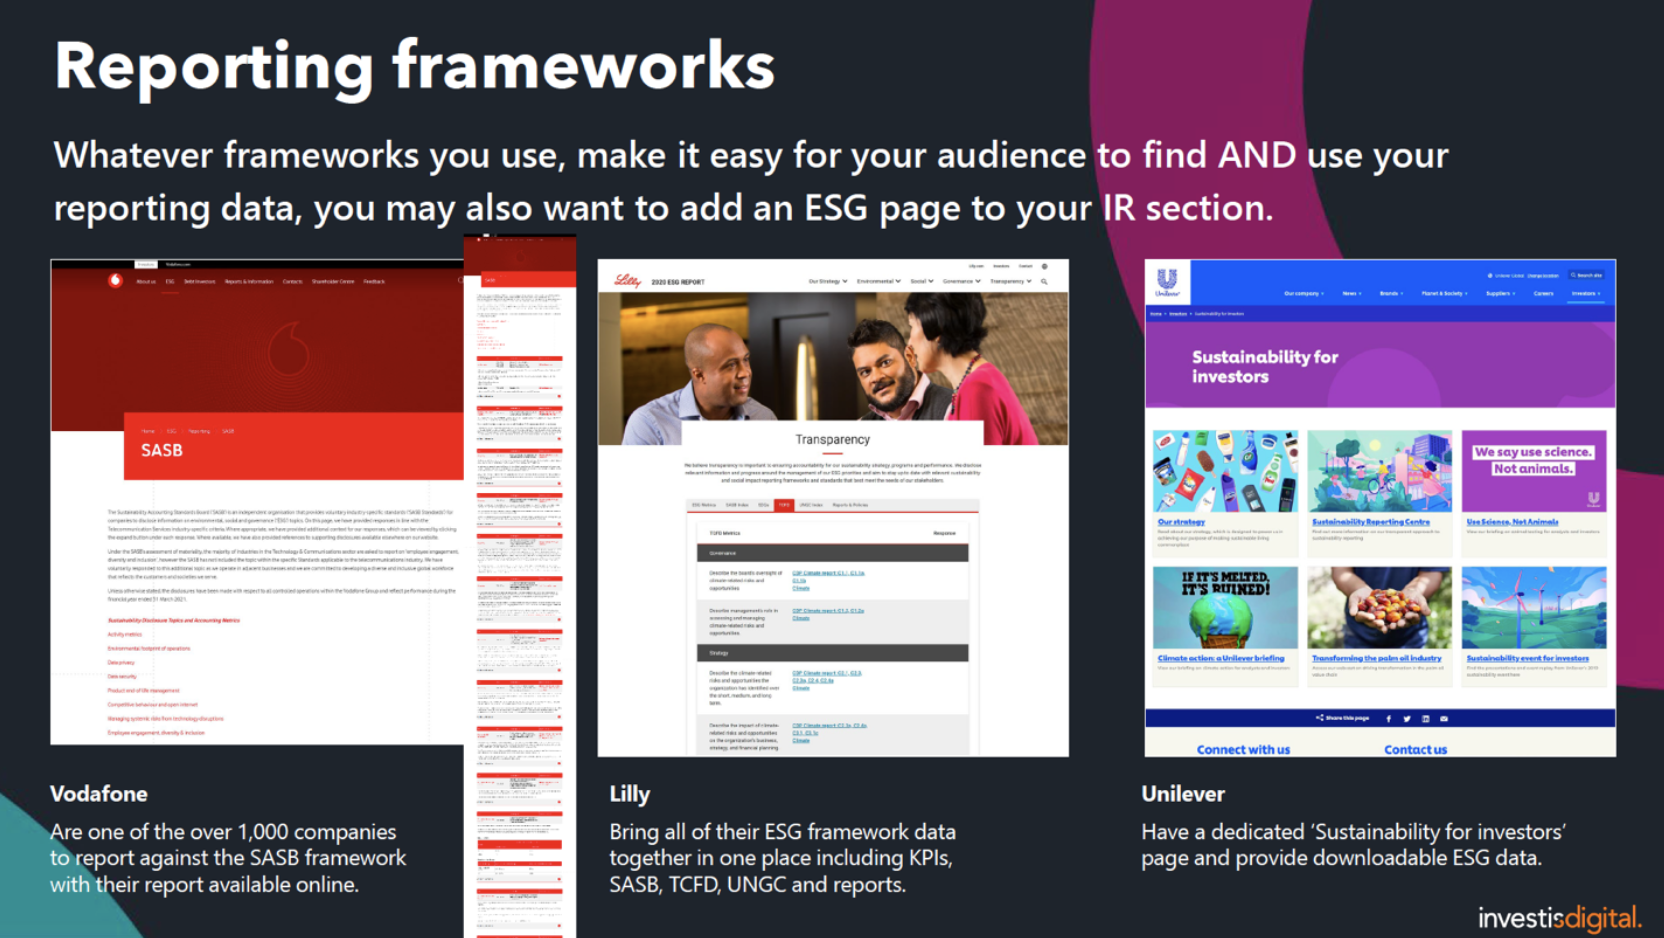
Reporting frameworks
It’s all very good for companies to be reporting, but they need to make this information easy to find. I like how Vodafone’s online SASB report and Lilly provide various strands of data on one page:
We’re also seeing an increasing number of companies adopting an ESG for investors page in their IR section to direct investors to key ESG content regardless of where that information resides on the website.
Wrapping it up: things to consider
Your corporate website plays a vital role in communicating with investors – but is yours delivering the content they need and the experience they expect about ESG? The answer is going to increasingly separate leaders from followers. One reason is that more businesses are getting savvy at sharing essential IR/ESG-related content as our examples show. For instance, they’re responding to the need to use video in order to share compelling cases of how they meet their ESG goals. But as this blog post demonstrates time and again, reporting measurable progress on essential data such as ESG goals and corporate strategy initiatives is all-too-often lacking. The more you report and the more you measure, the more you lead.
Contact Investis Digital
To learn how we can help you audit how strategic and valuable your corporate/IR site is, see more of our investor relations resources or contact us. We’ll apply our proprietary Connect.IQ methodology to help you see how you measure up.